SCCM Health Dashboard: Your Daily Checks in One Screen
Daily SCCM operations require consistent health checks across multiple components site servers, databases, distribution points, client health, and scheduled processes. In most environments, these checks are performed manually by switching between different consoles, reports, and scripts, which is time-consuming and prone to being overlooked during busy operational days.
To simplify this routine, I built SCCM Health Monitor: a centralized dashboard that brings together all daily infrastructure health indicators into a single, real-time view. In addition to visual monitoring, the solution includes automated email notifications to proactively alert administrators when predefined thresholds or critical conditions are met.
What It Monitors
The dashboard continuously tracks critical SCCM infrastructure metrics, including:
- Site server availability and component health
- Database size and last successful backup status
- Distribution point content synchronization
- Client health compliance and trend analysis
- Software update synchronization state
- Recent critical and warning-level errors (last 24 hours)
- Inbox file queue thresholds
- Active deployments and package status
- Task sequence execution status
Data is collected every 5 minutes via a scheduled task, while the dashboard automatically refreshes every 60 seconds.
Automated email alerts are triggered whenever defined critical thresholds are exceeded.
Installation
The installation is straightforward. The script handles IIS configuration, scheduled task creation, and initial setup automatically.
Step 1: Configure Email Settings
Before running the installation, edit the config.json file to set up your email alerts:
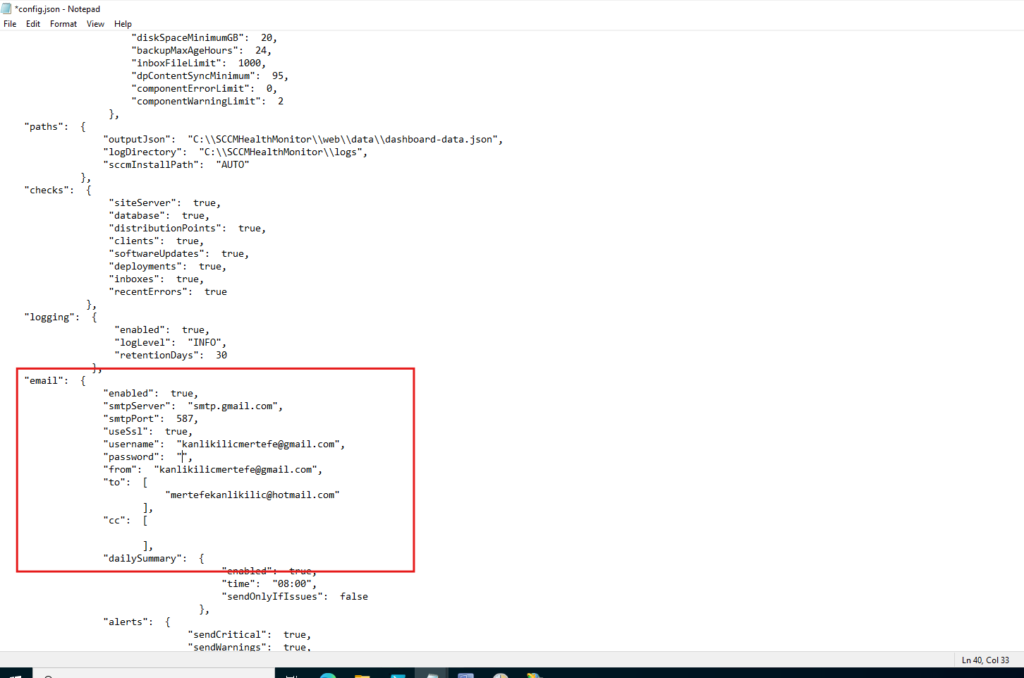
You’ll need to configure:
smtpServer: Your SMTP server address (e.g., smtp.gmail.com)smtpPort: SMTP port (usually 587)useSsl: Set to true for secure connectionusername: SMTP authentication usernamepassword: SMTP passwordfrom: Sender email addressto: Array of recipient email addresses
Step 2: Run the Installation Script
Open PowerShell as Administrator on your SCCM site server, navigate to the downloaded folder, and run:
.\install.ps1
The installation wizard performs several checks:
- Verifies you’re running as Administrator
- Checks if the installation path exists
- Confirms all required files are present
- Detects your SCCM site server
The script then:
- Updates the configuration with your site details
- Sets up IIS and creates the web application
- Configures directory permissions
- Creates a scheduled task for data collection
- Performs initial data collection

At the end, it asks if you want to send a test email. Enter y to verify your email configuration works correctly.
Step 3: Verify IIS Configuration
The installer automatically creates an IIS application. Open IIS Manager to verify:
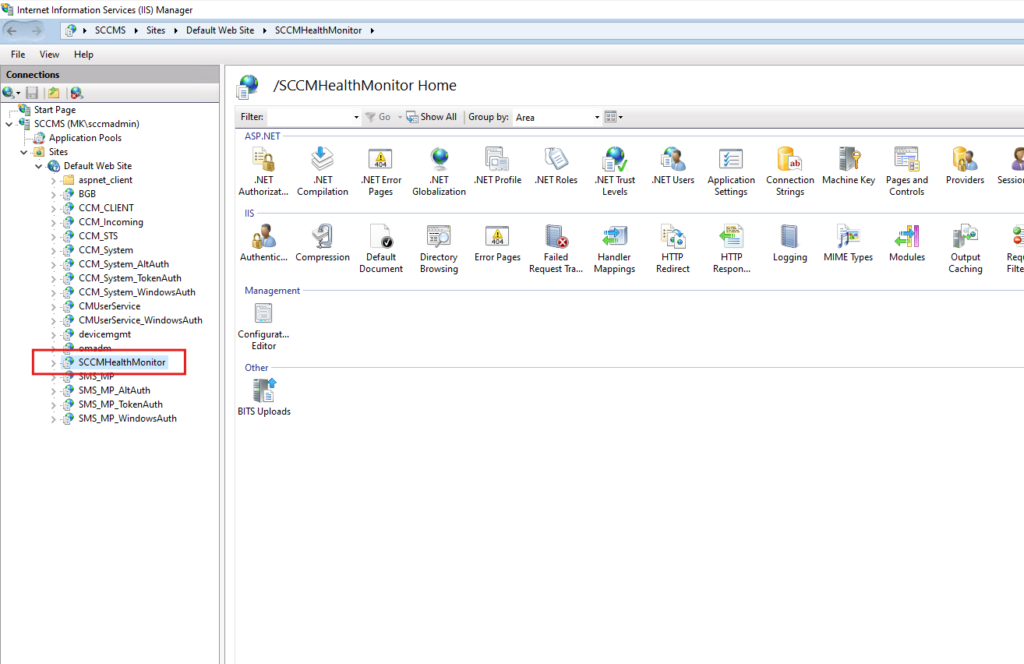
You should see “SCCMHealthMonitor” under your Default Web Site at the path you specified. The dashboard is now accessible at http://localhost/SCCMHealthMonitor/
Step 4: Check Scheduled Task
Data collection runs automatically every 5 minutes via a scheduled task. Open Task Scheduler to verify:
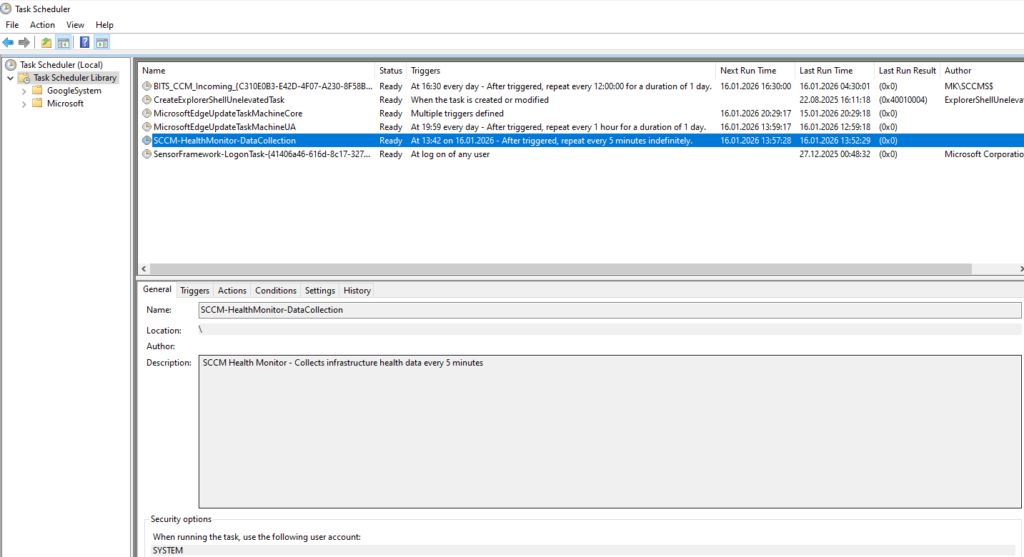
Look for “SCCM-HealthMonitor-DataCollection” in the Task Scheduler Library. It should be in “Ready” state and configured to run every 5 minutes indefinitely as the SYSTEM account.
Using the Dashboard
Now let’s see what you can do with it.
Main Dashboard View
Navigate to http://localhost/SCCMHealthMonitor/ in your browser:
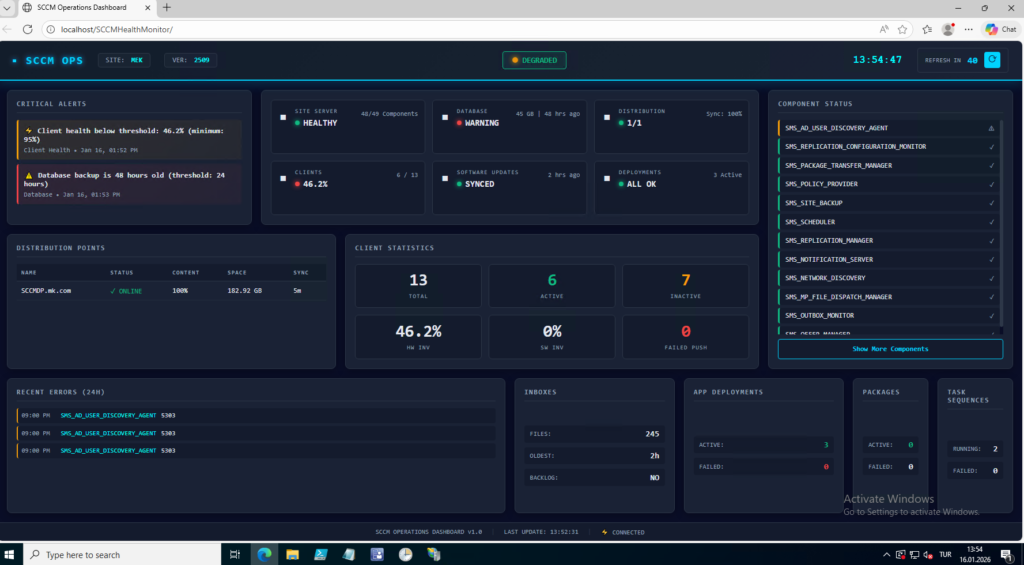
The main dashboard displays:
- Critical Alerts: Issues requiring immediate attention (top left)
- Site Server Status: Overall health with component count
- Database Status: Size and last backup time
- Distribution Points: Sync status
- Client Statistics: Total, active, inactive clients and health percentage
- Software Updates: Last sync time and status
- Deployments & Packages: Active counts
- Component Status: All site components listed on the right
- Recent Errors: Latest errors from the past 24 hours
- Inboxes: File counts in various inboxes
Component Details
Click “Show More Components” to see all site system components:
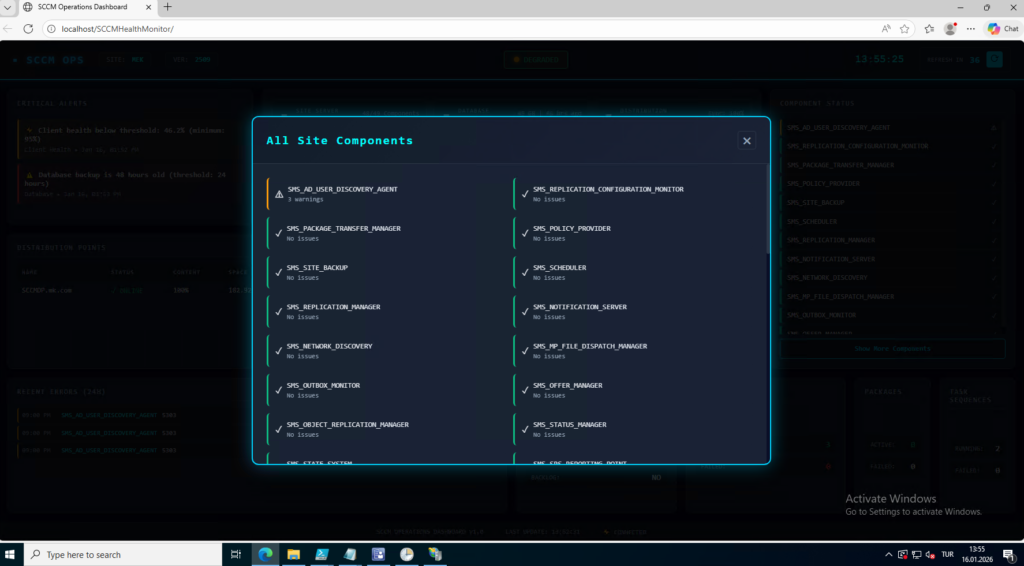
This modal shows every SCCM component with its current status. Green checkmarks indicate healthy components, warning icons show components with issues.
Software Updates Details
Click on the Software Updates card for detailed synchronization information:
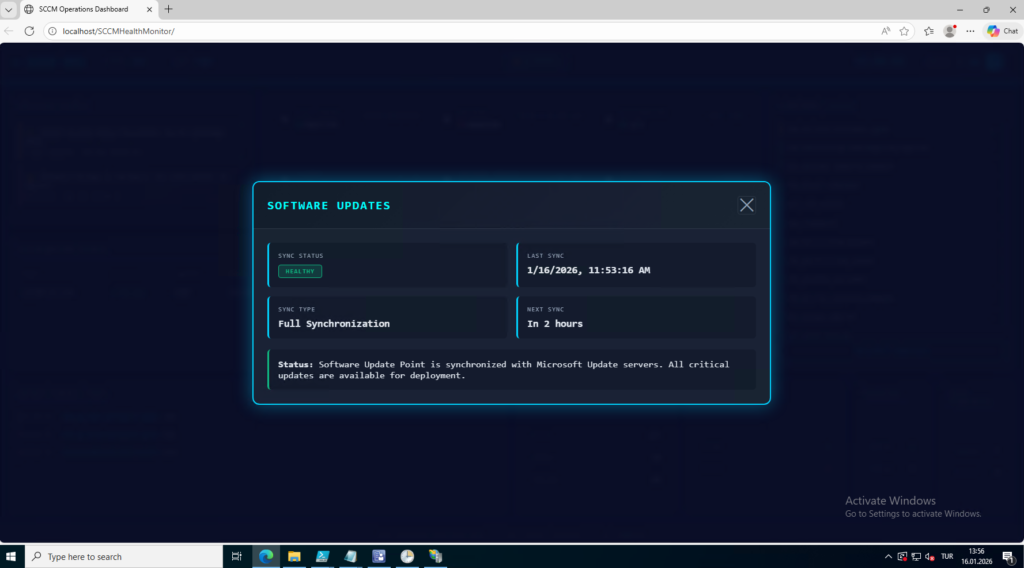
You’ll see:
- Sync status (Healthy/Warning)
- Last sync timestamp
- Next scheduled sync time
- Detailed status message
Email Alerts
When critical issues are detected, the system automatically sends email alerts:
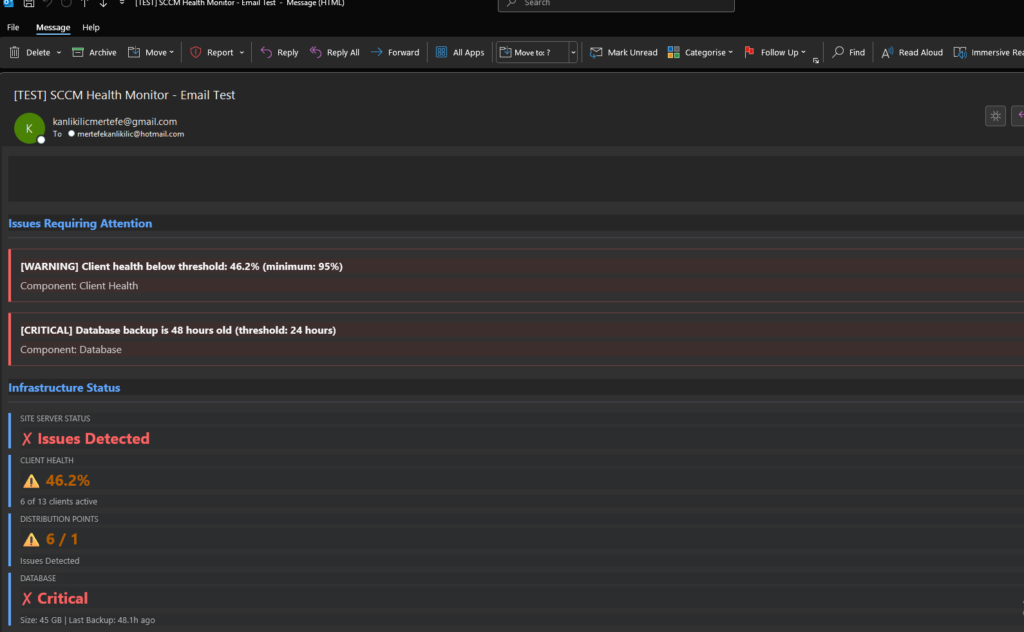
The email includes:
- Issues requiring attention (color-coded by severity)
- Infrastructure status summary
- Site server status
- Client health metrics
- Distribution point status
- Database status with backup time
How It Works
The solution consists of three main components:
- Data Collection Script (
Start-SCCMHealthMonitor.ps1): Runs every 5 minutes via scheduled task, queries SCCM database and WMI, collects health data, and outputs todashboard-data.json - Web Dashboard (
index.html): Reads the JSON data file, displays real-time health status, auto-refreshes every 60 seconds - Email Alert System: Monitors for critical issues, sends formatted HTML emails when thresholds are exceeded
This dashboard made monitoring my SCCM environment much easier. Everything’s in one place instead of jumping between consoles. The email alerts are particularly useful for catching issues outside of business hours.
The project is open source, so feel free to fork it and customize it for your needs. If you run into issues or have suggestions, open an issue on GitHub.
GitHub Repository: https://github.com/Kanlikilic/SCCM_Health_Monitor